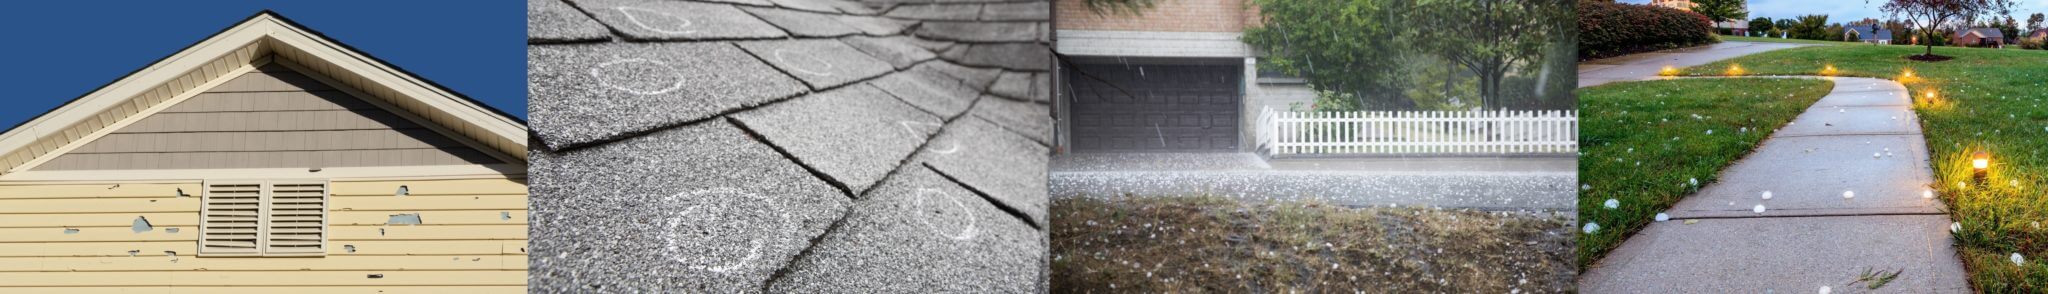
Insurers know where damaging hail is likely to fall.
Hail claims account for $6.2 billion per year in insurance losses.1 To help mitigate these losses, insurers typically make underwriting decisions based on where damaging hail is likely to fall.
But where hail falls—and where hail claims are most likely—are two different things.
Case in point: Nebraska, Kansas, and South Dakota are states with the most severe hail days annually.2 However, it is Texas—a much larger, more populated state—that has the most hail claims. And there is an added layer of complexity: within hail hazard zones there is significant variation in structure vulnerability and claims patterns.
As a result, hail claims frequency and losses vary enormously within the same hail hazard zone—
and even within the same ZIP Code.
Given these challenges, how can insurers better predict hail claims frequency and improve underwriting results?
Introducing HailRisk™ by Location, Inc.
HailRisk is the first and only predictor of hail claims frequency.
Built from a broad, diverse and proprietary national database, only HailRisk looks at the disparate causes of hail damage and their complex interactions to predict the probability and severity of loss from hail—for any location nationwide. Discover how HailRisk can dramatically improve your underwriting results today.
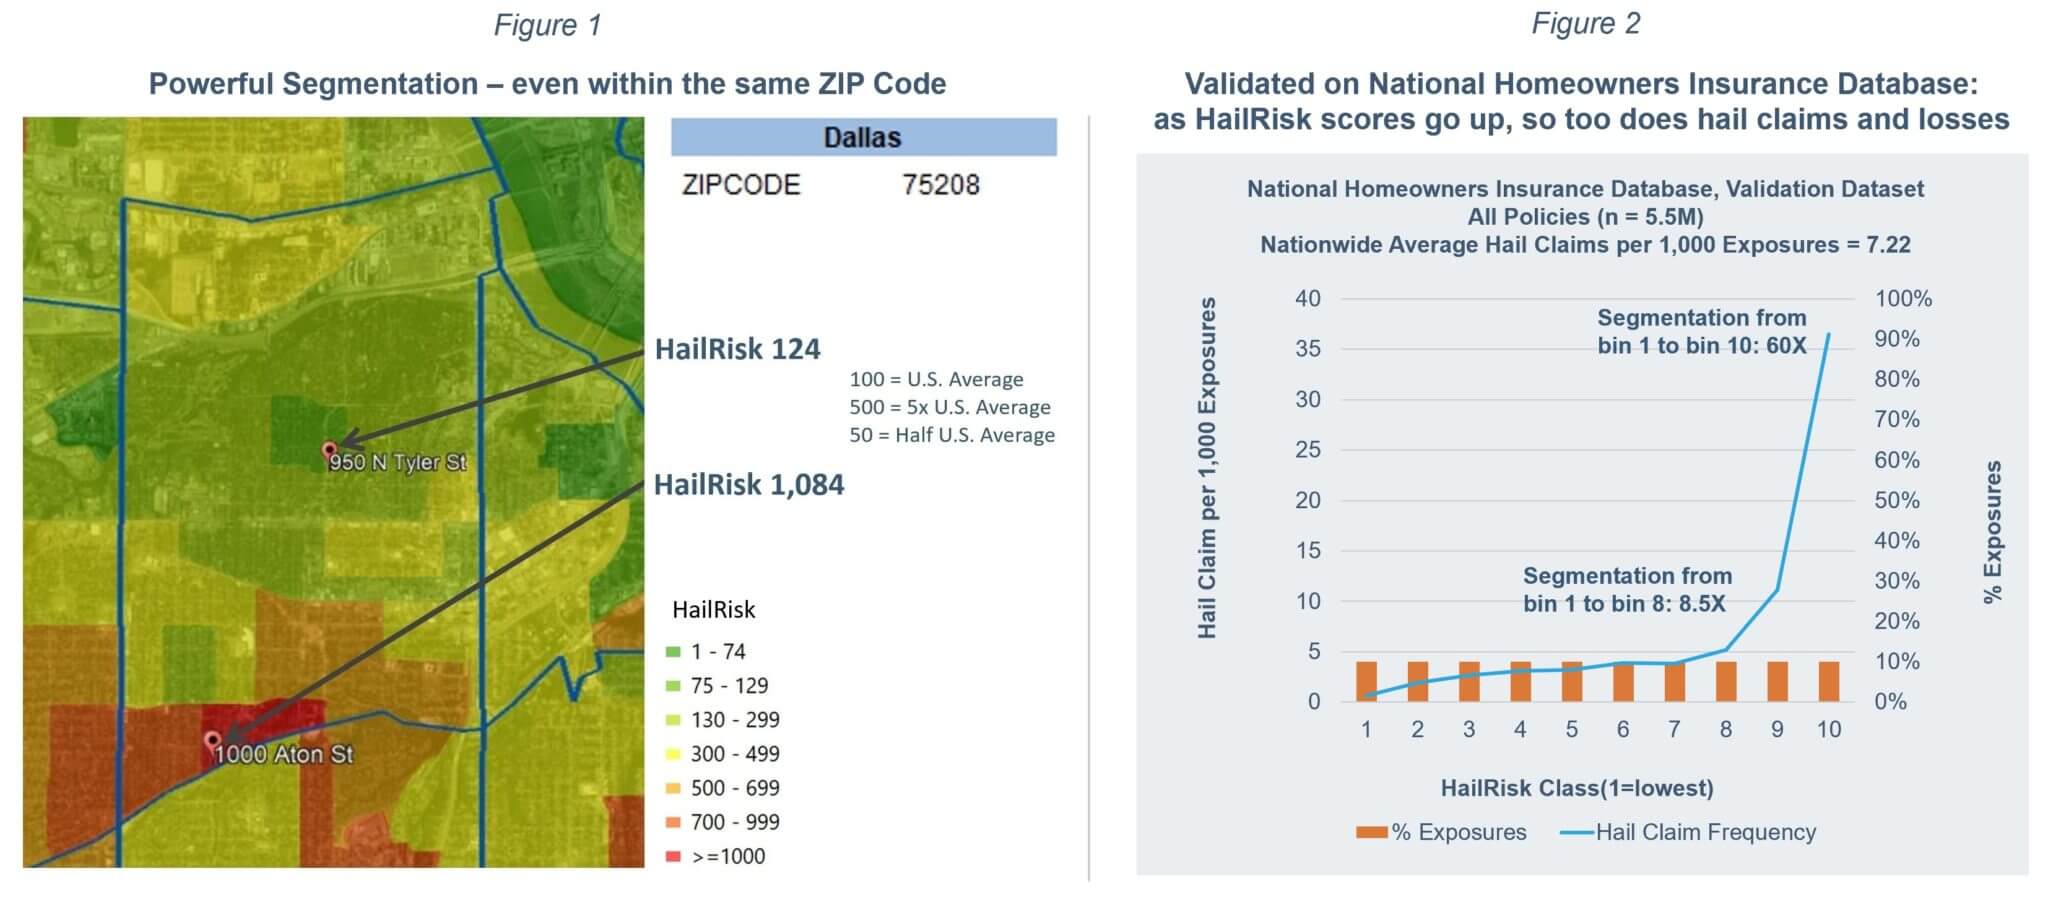
Powerful segmentation—even within the same ZIP Code
HailRisk generates block level scores based on risk for any U.S. address. There are 11 million blocks nationwide, versus only 33,000 ZIP Codes, so these data are more than 300X the resolution of the average ZIP Code. As a result, HailRisk often uncovers powerful segmentation—even within the same ZIP Code.
In the example below (Figure 1), two addresses within the same Dallas ZIP Code have HailRisk scores above the U.S. average. This is expected because there is a uniformly high risk of hail events in the Dallas area. Yet HailRisk goes beyond predicting where hail will fall to reveal significant hail claims variation within the ZIP Code: the risk score of the North Tyler St address is slightly above the national average, compared to the Aton St address, which is 10X the national average.
HailRisk is highly predictive of hail claims frequency, and has been validated using Location, Inc.’s exclusive national insurance industry database (Figure 2): as the HailRisk score increases, so too does the frequency of claims. As a result, HailRisk helps account for $6.2 billion in annual Homeowner’s hail damage claims losses.
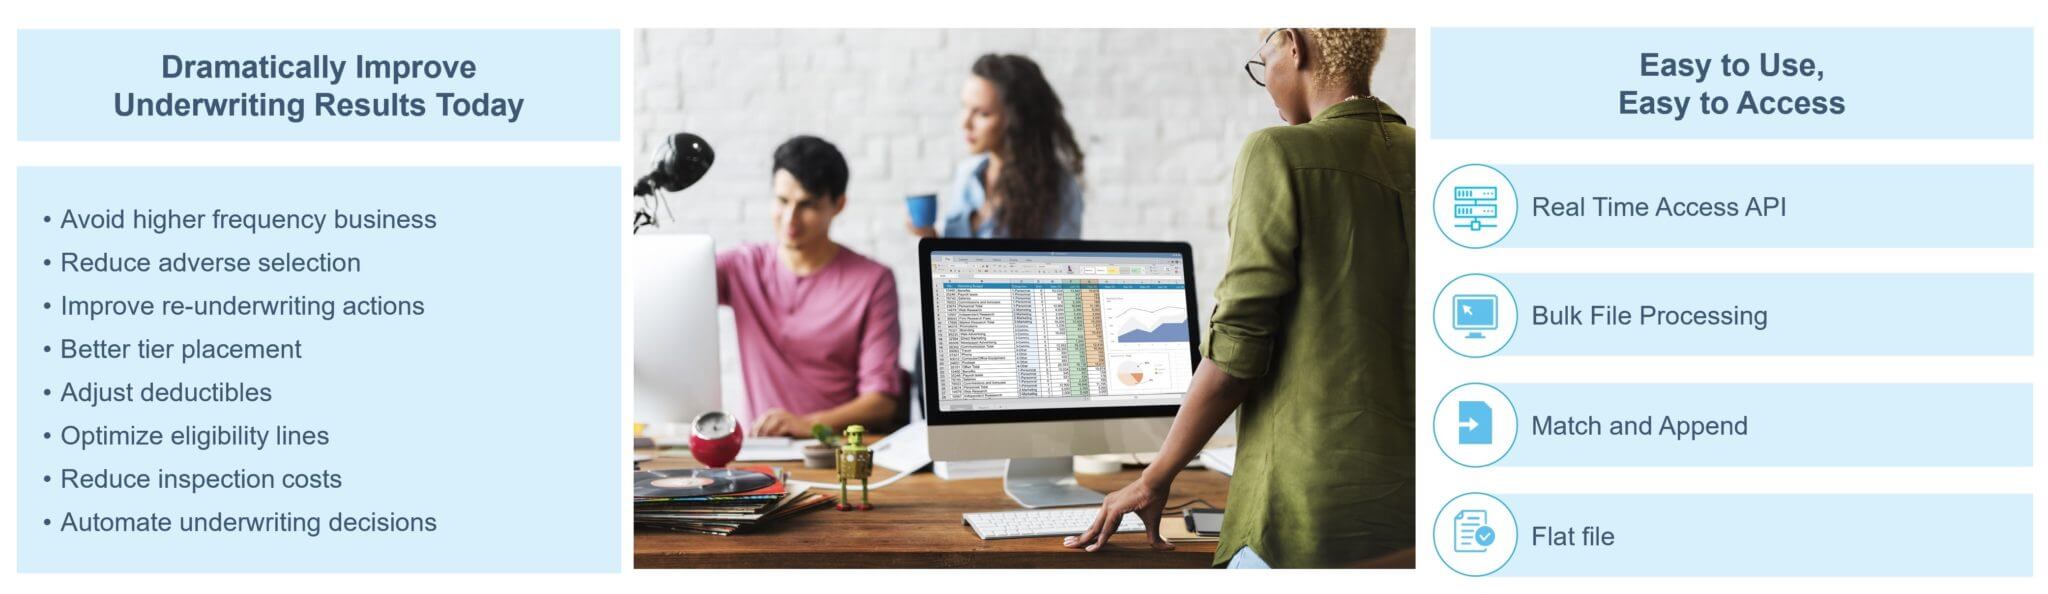
What HailRisk can do for you
REQUEST YOUR COMPLIMENTARY PORTFOLIO RISK EXPOSURE ANALYSIS
DISCOVER HOW HAILRISK™ CAN DRAMATICALLY IMPROVE YOUR UNDERWRITING RESULTS
GET STARTED NOW1. Location, Inc.’s analysis of insurance carrier loss data, corroborated by third-party industry data from the Insurance Journal and the Insurance Information Institute. Losses = $41.2B net of Reinsurance.
2. National Oceanic and Atmospheric Administration: Severe Hail Days per Year from 2003-2012 Reports Days with at least 1 report of inch+ hail within 25 miles.