Structures burn 80% faster today than they did 30 years ago.
Why? The proliferation of petroleum-based furnishings in homes and commercial buildings, such as petroleum based carpets, drapes, furniture foams, and plastic piping and hoses that spread fire from room to room, cause structures to burn far more quickly.1 Once a fire spreads, the fire department simply cannot get to the structure fast enough to limit the losses.
The best predictor of fire losses today:
The likelihood of a fire starting in the first place.
FireRisk predicts the probability and severity of loss from fire—for any address nationwide. Discover how FireRisk can dramatically improve your underwriting results.
- Homeowner's Insurance
- Commercial Insurance
Introducing FireRisk™ by Location, Inc.
Because houses burn much faster today, the most predictive indicator of fire losses is knowing the likelihood of a fire starting in the first place. Once a fire spreads, the fire department simply cannot get to the home fast enough to limit the losses.
However, predicting the likelihood of fire is extraordinarily difficult. Approximately 84% of structure fires are caused by a diversity of non-weather risks1 (Figure 1)—and the data on these causes, while predictive, are difficult to collect.

FireRisk is the first and only predictor of the frequency of structure fires.
Built from a broad, diverse and proprietary national database, FireRisk looks at the disparate causes of fire damage and their complex interactions to predict the probability and severity of loss from fire—for any address nationwide.
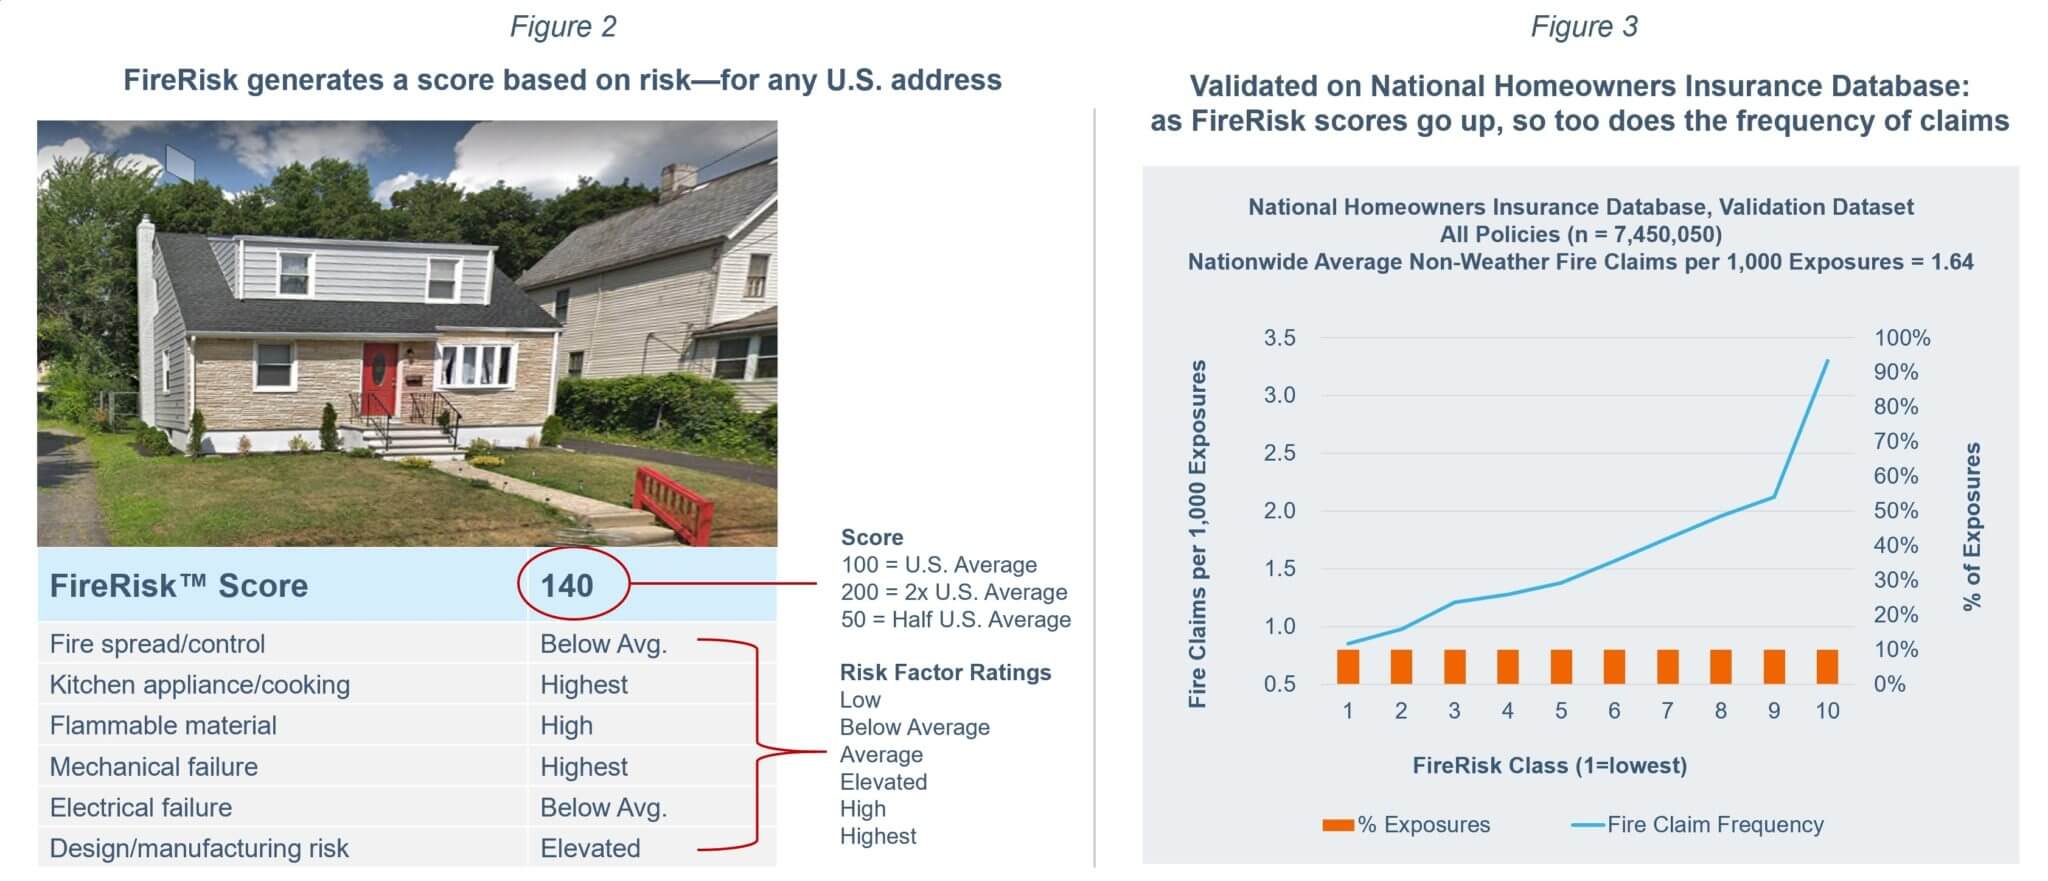
FireRisk generates a score based on risk—for any U.S. address. This Plainfield, NJ address (Figure 2) has a score of 140, which is 40% above the national average score of 100. Listed with the score are factors that contribute to the non-weather fire damage risks at the address, to help convey some of the primary reasons why the risk is higher.2
FireRisk is highly predictive of the frequency and losses from non-weather fire damage claims, and has been validated against Location, Inc.’s exclusive national insurance industry database (Figure 3). As the FireRisk score increases, so too does the frequency of claims. As a result, FireRisk uniquely predicts fire frequency, helping to fill an unquantified gap that accounts for about 14% of all Homeowner’s losses, $5.8 Billion per year.3

What FireRisk can do for you

REQUEST YOUR COMPLIMENTARY PORTFOLIO RISK EXPOSURE ANALYSIS
DISCOVER HOW FIRERISK™ CAN DRAMATICALLY IMPROVE YOUR UNDERWRITING RESULTS
GET STARTED NOW1. Study from Underwriters Laboratories and the National Fire Protection Association.
2. FireRisk is not a sub-score based index; the factors that contribute to non-weather fire damage risks are listed simply to help convey why the risk is low or high for an address but do not quantitatively sum to the FireRisk score.
3. Location, Inc.’s analysis of insurance carrier loss data, corroborated by third-party industry data from the Insurance Journal and the Insurance Information Institute. Total Homeowner’s Losses = $41.2B net of Reinsurance.
Introducing FireRisk™ by Location, Inc.
Because structures burn more quickly, the most predictive indicator of fire losses is knowing the likelihood of a fire starting in the first place. Once a fire spreads, the fire department simply cannot get to the structure fast enough to limit the losses.
However, predicting the likelihood of fire is extraordinarily difficult. Approximately 84% of structure fires are caused by a diversity of non-weather risks1 (Figure 1)—and the data on these causes, while predictive, are difficult to collect.

FireRisk is the first and only predictor of the frequency of structure fires.
Built from a broad, diverse and proprietary national database, FireRisk looks at the disparate causes of non-weather fire damage and their complex interactions to predict the probability and severity of loss from fire—for any address nationwide.
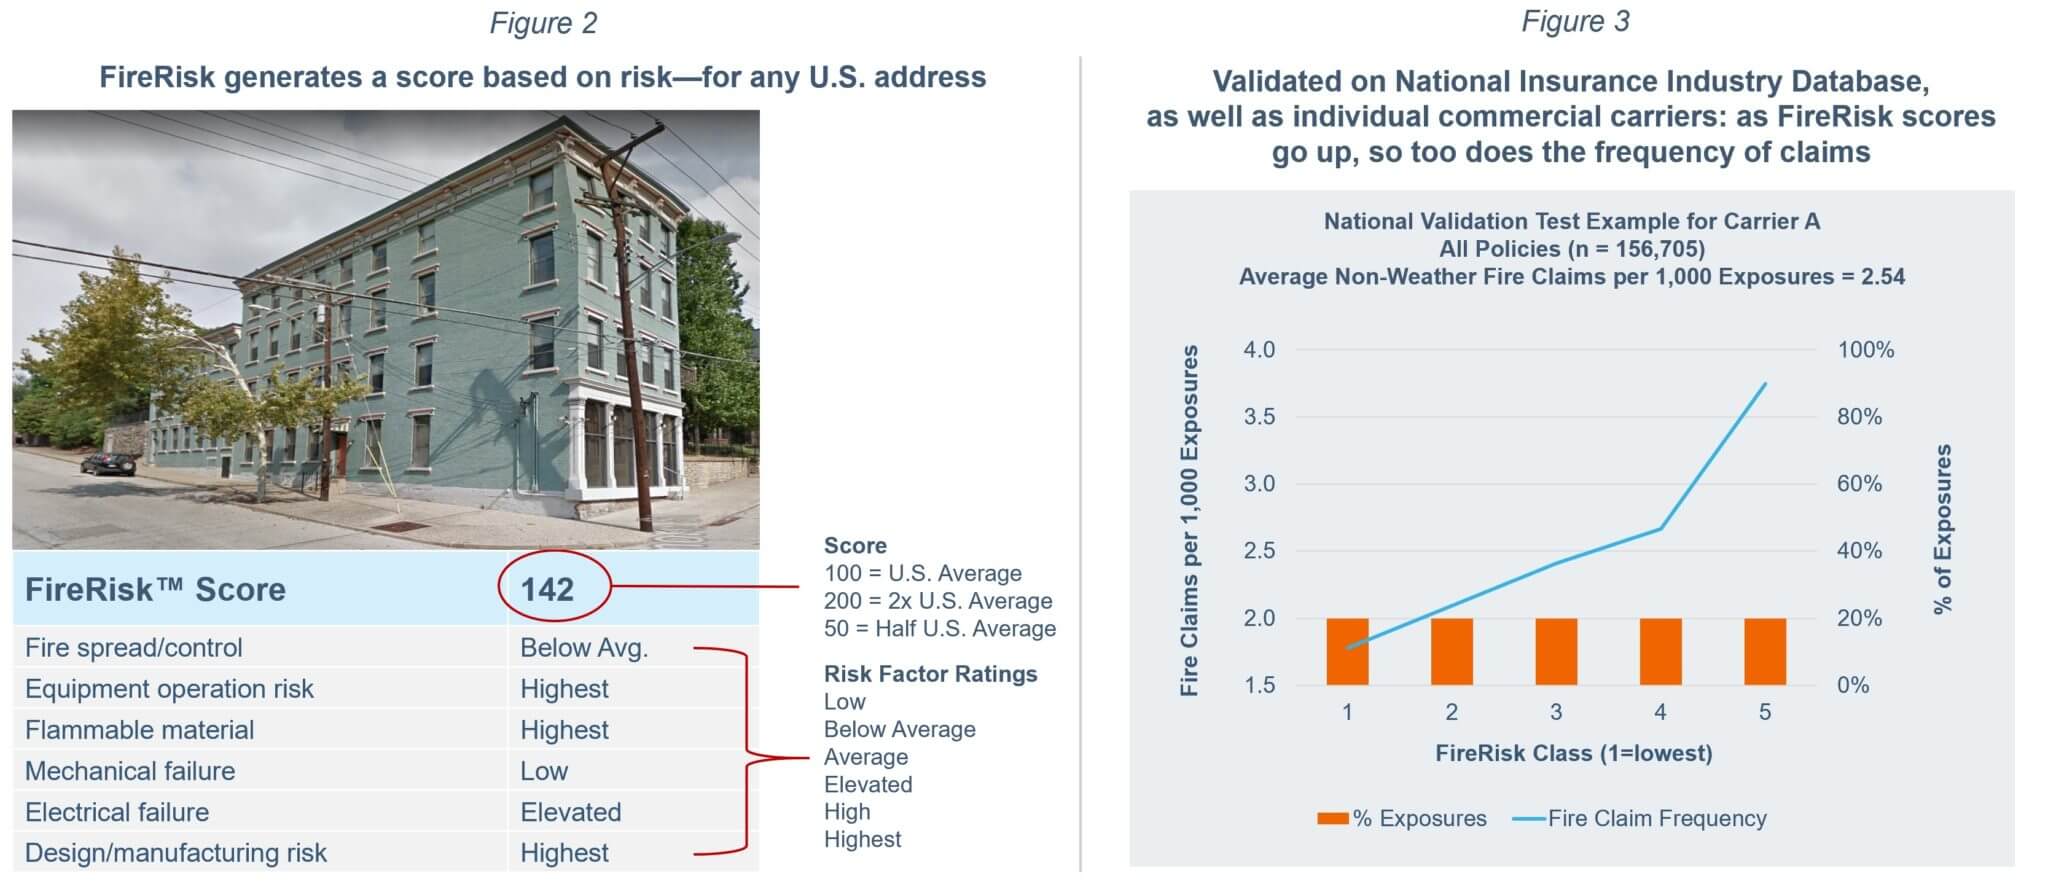
FireRisk generates a score based on risk—for any U.S. address. This Cincinnati, OH address (Figure 2) has a score of 142, which is 42% above the national average score of 100. Listed with the score are factors that contribute to the non-weather fire damage risks at the address, to help convey some of the primary reasons why the risk is higher.2
FireRisk is highly predictive of the frequency and losses from non-weather fire damage claims, and has been validated against Location, Inc.’s exclusive national insurance industry database, as well as individual commercial carriers (Figure 3). As the FireRisk score increases, so too does the frequency of claims. As a result, FireRisk uniquely predicts fire frequency, helping to fill an unquantified gap that accounts for about 29% of all Commercial losses, $4.9 Billion per year.3

What FireRisk can do for you

REQUEST YOUR COMPLIMENTARY PORTFOLIO RISK EXPOSURE ANALYSIS
DISCOVER HOW FIRERISK™ CAN DRAMATICALLY IMPROVE YOUR UNDERWRITING RESULTS
GET STARTED NOW1. Study from Underwriters Laboratories and the National Fire Protection Association.
2. FireRisk™ is not a sub-score based index; the factors that contribute to non-weather fire damage risks are listed simply to help convey why the risk is low or high for an address but do not quantitatively sum to the FireRisk score.
3. The Insurance Information Institute’s “Facts + Statistics: Fire” and “Facts + Statistics: Commercial Lines”, and a study performed by The Hartford, a financial services company, analyzed claims data from over one million policies purchased by small business owners. The data covered a five-year period (2010 through 2014) and applied to liability, auto and property claims.