Our patent-pending school ratings data for the first time allow direct comparison of the school quality in any neighborhood or school anywhere in the nation.
Location, Inc. has built the only nationally-comparable school quality ratings available today. These patent-pending ratings cover every public school and public school district in the United States. These powerful ratings have also been applied directly to neighborhoods, allowing polygon mapping by school quality, and property search by school quality. Indices include overall quality ratings, and ratings based on math proficiency, as well as ratings based on reading proficiency.
Apply these analytics to your real estate investment initiatives or commercial site selection processes and make informed decisions before you open a new branch or relocate your company. Location, Inc.’s proprietary school data are valuable for industries including investing, real estate, real estate investment trusts (REITs), commercial real estate investment, multi-family real estate investment, appraisals, corporate and employee relocation, direct marketing, and site selection. Combining these exclusive school data with our lifestyle and demographic data, crime data, house value data, and more, can provide powerful data tools for the real estate, mortgage, and site selection industries.
Access: Neighborhood and school ratings have national coverage. Data retrievable by property address, or available in shape file format for mapping, search, and analysis. To be housed behind your firewall.
About the Data
For the first time ever, our patent-pending school ratings data allow parents, teachers and businesses to directly compare the quality of schools, districts and even neighborhood school quality in different states. No other provider offers these insights to provide a true comparison.
The comparisons are made possible by Location, Inc.’s patent-pending school rating algorithm, which uses each state’s own student passing rate on the National Assessment for Educational Progress (NAEP), a national student sampling test and the basis of “The Nation’s Report Card,” to normalize the state-specific No Child Left Behind’ (NCLB) test scores at each public school in every state.
The Importance of This Cannot Be Overstated.
While theoretically, the concept of a national NCLB standardized test should provide a milestone by which to compare the performance of all of the schools in the country relative to one another, the actual test is not truly standardized. This is because while the federal government passed down guidelines and standards for the creation of a testing mechanism, the states themselves were left to develop, implement and administer the actual NCLB tests.
One can easily appreciate that since the federal education grants provided to a state are based on the state’s performance on the NCLB tests and since the states are then charged with authoring and administering their NCLB test, there is an incentive to create a system that skews the results in order to obtain higher grant awards.
As Time Magazine reported, the ultimate result was that many states made their job easier by simply setting their own bar lower. A race to the bottom ensued where every state declared that its kids were better than average based on their test results. Take the amazing case of Mississippi, where according to the standards it set for itself, in 2005 tests 89% of its fourth-graders were proficient or better in reading, making them the best in the nation. Yet according to the random sampling done every few years by the National Assessment of Educational Progress (NAEP) test, a mere 18% of the state’s fourth-graders were proficient, making them the worst in the nation.
As a result, despite the federal guidelines and standards, there is still a wide variation in the difficulty and content of the actual tests that have been implemented from state to state. Therefore any school comparison system that employs strictly the NCLB results as a basis for comparison – like GreatSchools.net – is likely skewed due to the widespread differences in the underlying tests.
Accordingly, there is a need for a method and system that provides normalization of the performance data for all school districts across the nation, and which can provide a meaningful basis for comparison of school performance on a national basis.
This exclusive school rating system we have invented provides a method that normalizes student testing data to facilitate a true comparison of all of the various public school districts across the nation by normalizing the state-specific test results to a national standard. The school ratings that result provide a meaningful basis for comparison of school performance statistics on a national basis.
We provide these exclusive standardized ratings for every public school, school district, and every neighborhood in America, to help your company or investors make easy comparisons and informed decisions on where to relocate, invest, or grow your company.
Key Proprietary Data Points – Schools
- Nationally comparable school district ratings for every district in America (patent-pending)
- Nationally comparable neighborhood school quality index for every neighborhood in America (patent-pending)
- Nationally comparable school ratings for most public schools in America (patent-pending)
- Assignment of individual schools to individual neighborhoods (patent-pending)
- Nationally comparable ranking of all cities, towns, and neighborhoods by public school quality patent-pending)
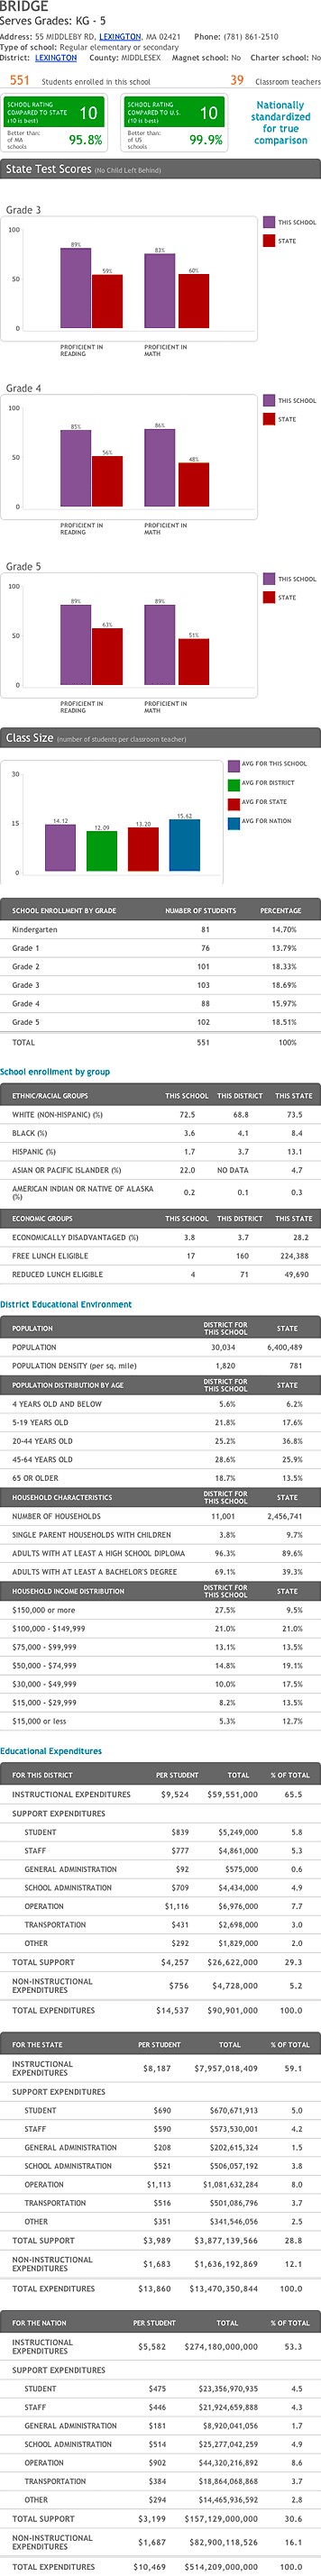
Our data set also includes hundreds of other data showing the types of students attending any school and district, how the district spends your tax money, demographics by school and by district, detailed test scores by school and by grade and district, and much more.