Total Crime Rate Per 1,000 Population
The ratio of total violent crimes and property crimes in an area to the population of that area; expressed per 1,000 population.
“Many people think that just summing the number of crimes in a community makes it possible to compare crime risk among communities,” says Dr. Andrew Schiller, CEO & Founder of Location, Inc., the parent company of NeighborhoodScout. “Big cities often have large numbers of crime. However, when we normalize for population in the city, the crime rate per population is often not as high as one would think.”
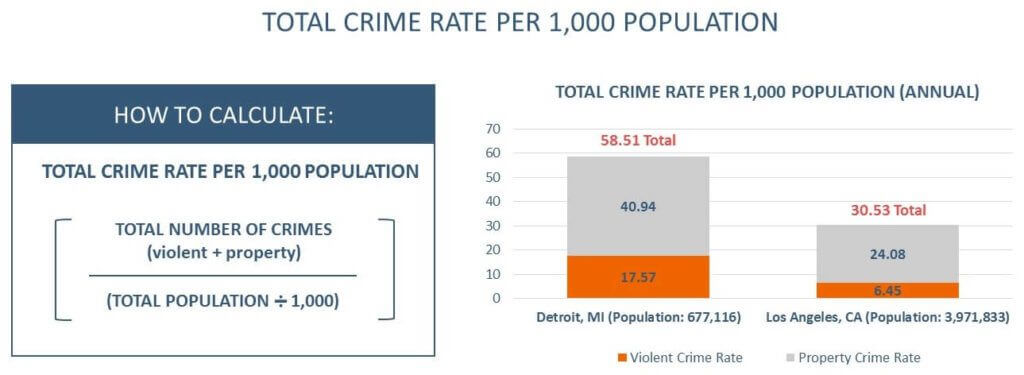
To demonstrate this point, Dr. Schiller compares crime rates in two cities: Los Angeles, CA (population: 3,971,833) and Detroit, MI (population: 677,116).
“During this time period, Los Angeles had many more crimes than Detroit (121,241 vs. 39,617 in Detroit). Yet, that doesn’t mean that Los Angeles is more dangerous. There are just more people,” explains Dr. Schiller. “When you normalize the data by the number of crimes per 1,000 population, you will see that Detroit is actually more dangerous than Los Angeles (58.51 total crime rate vs. 30.53 in Los Angeles). In fact, the Detroit crime rate is 92% higher than the crime rate experienced by Los Angeles. This isn’t revealed by the raw count of crimes.” (See image below).

“The data show that Detroit had 301 murders, 538 rapes, 3,459 armed robberies, and 7,599 assaults,” says Dr. Schiller. “When you realize that the population of Detroit is much smaller than Los Angeles, the violent crime numbers take on new meaning.”

Key Takeaway:
Calculating the Total Crime Rate Per 1,000 Population normalizes the data, making it easier to accurately interpret crime statistics at the local level and compare crime – and crime risk - among locations, including neighborhoods.


